Article
My Analysis Projects with Udacity

Airbnb in Singapore: Descriptive and Predictive Analytics
Description
Analyzing the Airbnb Dataset in Singapore with CRISP-DM process. The goal of this project was to explore and predict the important features in revenue returns from Airbnb rental income.
GitHub Repo
Medium Post

Customer Segmentation with PCA
Description
Using unsupervised learning techniques of Principal Component Analysis (PCA) and
KMeans to identify customer segments of the German population that were popular
or less popular with a mail-order.
GitHub Repo
Medium Post

Car Model Classification
Description
Build artificial neural network with transfer learning to classifying 196 classes of cars.
This time the pre-trained model used here is ResNet(Residual Neutral Network). The car dataset is
from Stanford and hosted on Kaggle.
GitHub Repo
Medium Post

Flower Species Classifier With PyTorch
Description
Build artificial neural network with transfer learning to classifying 102 flower species.
PyTorch was used in building the artificial neural network. The exploration was conducted in a notebook
with Google Colab because it provide free GPU.
GitHub Repo
Medium Post

Create a Tableau Story
Description
Data visualization using Tableau that tells a story or highlights trends or patterns in a baseball data set.
Practice of data visualization included visual encodings, design principles, and effective communication.
GitHub Repo
Medium Post

Twitter Archive Data Wrangling
Description
Data wrangling of the WeRateDogs tweets from twitter. First data gathering, then wrangling followed by analysis with Python.
Numpy, Pandas, Matplotlib, Seaborn, json, and Tweepy used to clean, analyze and visualize the results.
GitHub Repo

Exploratory Data Analysis using R
Description
Using R and apply exploratory data analysis techniques in a selected dataset to discover relationships among
multiple variables, and create explanatory visualizations illuminating distributions, outliers, and anomalies.
GitHub Repo
Medium Post

Test a Perceptual Phenomenon
Description
Using descriptive statistics and a statistical test to analyze the Stroop effect using Python.
Results interpretation in terms of hypotheses based on computed statistics results.
GitHub Repo
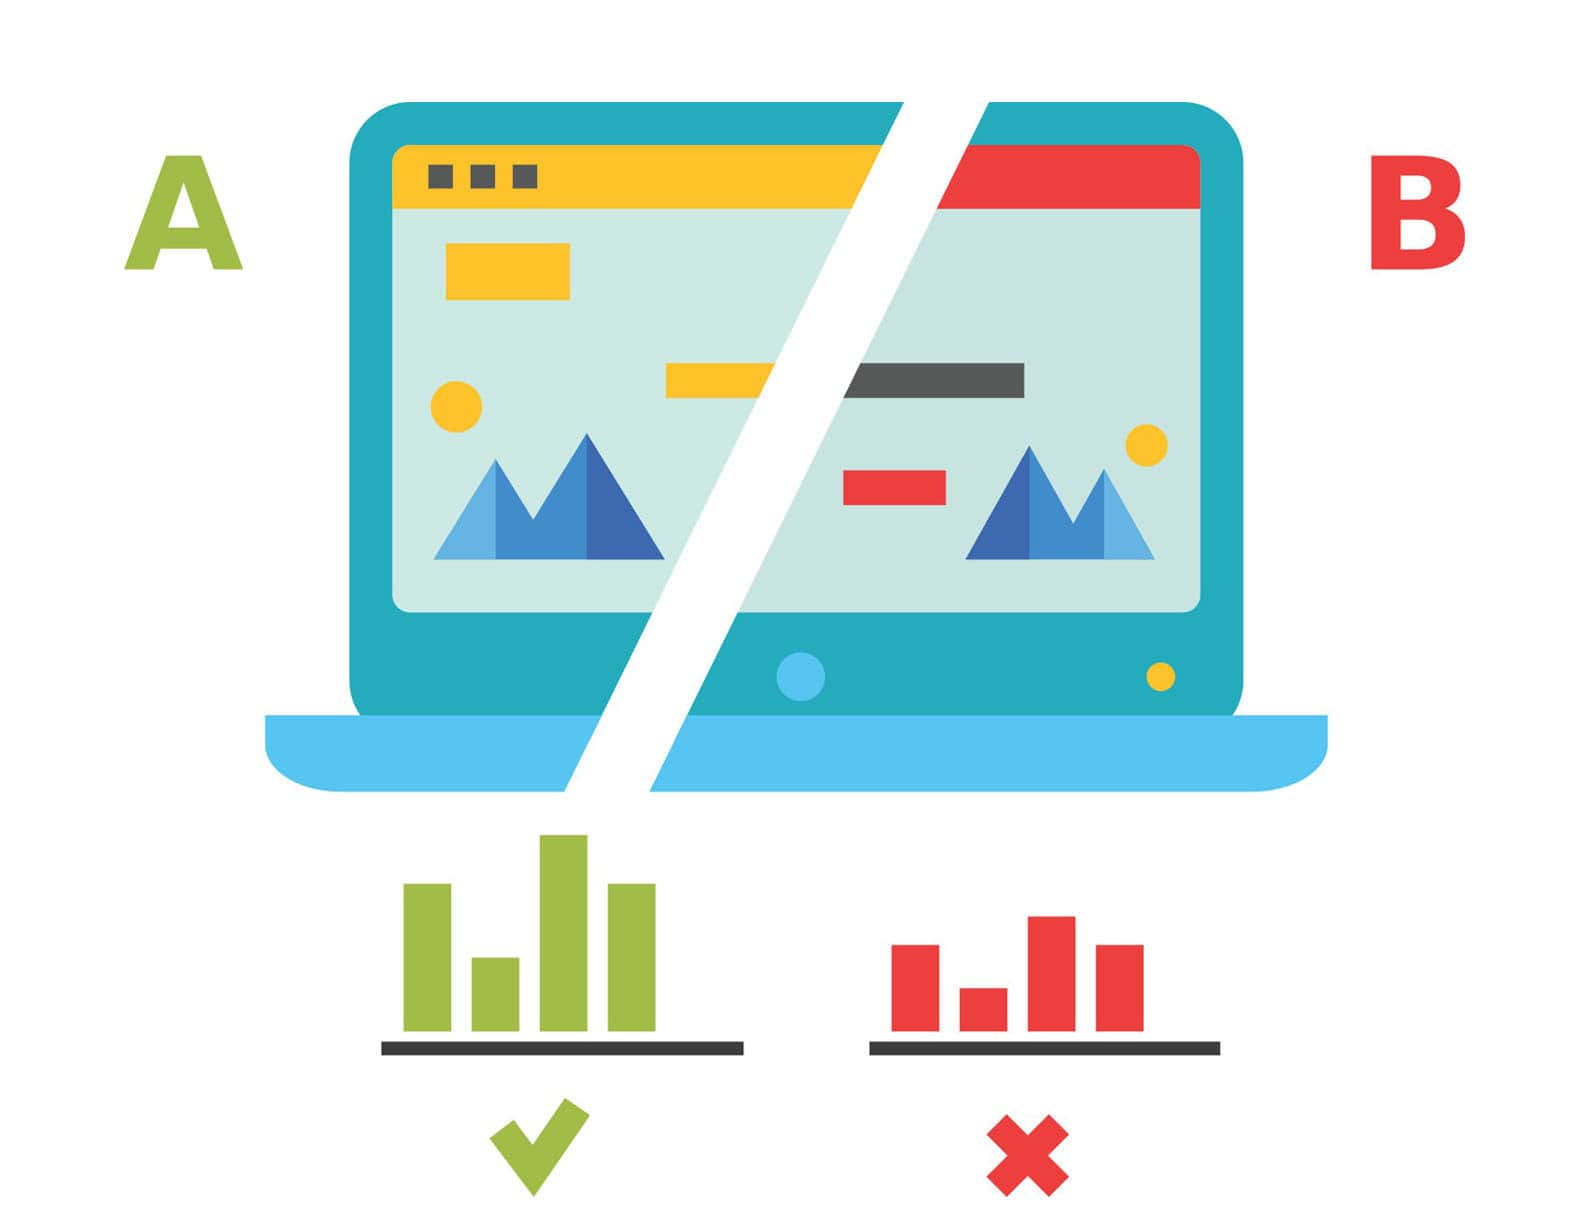
Analyzing A/B Test Results
Description
Using A/B test to determine wheather should implement new page or keep the old page. Bootstrapping, linear regression modeling
and t-test were used in this analysis. Python matplotlib used to visualize the results.
GitHub Repo
Medium Post

Investigate a Dataset
Description
Analyze a dataset by using the Python libraries NumPy, pandas, and Matplotlib to make the analysis easier.
The dataset from Kaggle which recorded patient show-up or no-show the appointment.
GitHub Repo
Medium Post
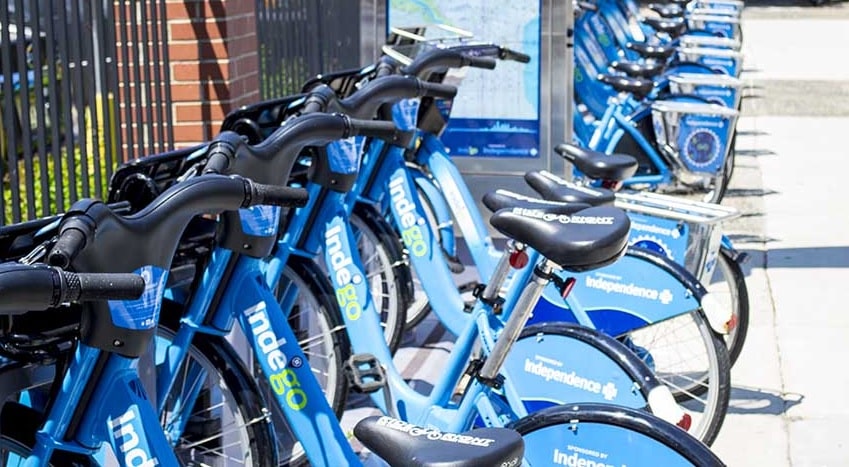
Exploring Bikeshare Data
Description
Explore the data related to bike share systems for three major cities in the United States—Chicago using Python Pandas
Create an interactive experience in the terminal to present the statistics result.
GitHub Repo

Exploring Weather Trends
Description
Analysis on local and global temperature data and compare the temperature trends where you live to overall global temperature trends.
GitHub Repo
Medium Post